Threads-Charts Usage
Installation and Usage
First of all, Threads-Charts does not "install" anything and you don't need root privileges to use it. It just needs 3 files - Makefile, threads_test.c, make_output - in the same directory with write permission.Other prerequisites are a C-complier (like gcc), sed, awk, paste and cut, which are all installed on any Unix (or Unixlike System). If you want to view the gnuplot file after the program has finished, you also need Gnuplot.
The steps needed:
- Download the source from Sourceforge and save the file threads-charts-XXX.tar.gz (the XXX is the version number, for example 0.4.1) to a directory you have write permission in (well, you cannot save it to a directory you don't have write permission in anyway ;). For the rest of this page, let's call this directory INSTALL_DIR
-
Change to the directory INSTALL_DIR and unpack the archive, like this:
[any time you need to type something in a terminal (shell), a window like the one below is shown]Do not close the terminal (shell) yet, you need to type the command from the next step in the same terminal (shell).Term:$ cd INSTALL_DIR
$ gunzip threads-charts-XXX.tar.gz
$ tar xvf threads-charts-XXX.tar.gz -
Run the benchmark by typing make in the terminal.
It takes some time till the program has finished, from 15 minutes on a 16 CPU Itanium II to an hour or more on slower machines. But on a recent system, it takes about half an hour to 45 minutes.Term:$ cd threads-charts-XXX
$ make
-
When the program has finished and Gnuplot is installed
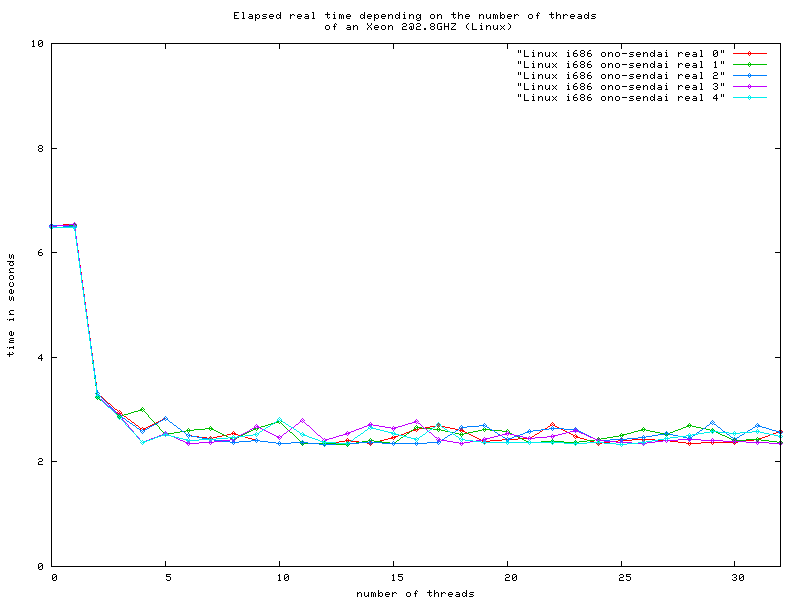
it displays the result as a chart showing 5 lines in it, like this:
Threads-Charts also saves the result to a gnuplot file and to a CSV file (where the fields are separeted by semicolons).
The files Threads-Charts writes to your directory
As said above, Threads-Charts saves the result to two files, a gnuplot file and a CSV file.
The name of the gnuplot file is like the following example:
Linux_i686_ono-sendai_gnuplot.gp where "Linux" is the name of your OS (the output of
"uname"), "i686" the hardware type (the output of "uname -m") and "ono-sendai" is the hostname
of your system (the output of "hostname"). To view this file, just input (of course you should change
the filename):
$ cd threads-charts-XXX
$ gnuplot -persist Linux_i686_ono-sendai_gnuplot.gp
The CSV file is a file any spreadsheet app can open (but it may have problems with the
semicolons as field separators, but they are necessary because in some coutries the comma
is used as the decimal separator), for example OpenOffice Calc or Gnumeric or Kspread or
MS Excel.
The CSV file is named in a similar manner as the gnuplot file, like this:
Linux_i686_ono-sendai.csvwhere "Linux" is the name of your OS (the output of
"uname"), "i686" the hardware type (the output of "uname -m") and "ono-sendai" is the hostname
of your system (the output of "hostname"). To view this file, just open it with your spreadsheet
app of your favour.
You can download result files from different CPUs and OSes from here
Troubleshooting
The executable doesn't compile
Threads-Charts tries to use the native compiler for each OS, if you don't have it installed (most of them are quite expensive) you can use GCC to compile the executable, but must do the two steps for yourself then.
$ cd threads-charts-XXX
$ make linux_gcc $ make output
If your OS isn't recognized (so far AIX, FreeBSD, HP-UX, Irix, Linux, NetBSD, OpenBSD, Solaris and True64 are) and you have gcc installed you should try
$ cd threads-charts-XXX
$ make linux_gcc $ make output
I get no graph after the programm has finished
You probably don't have gnuplot installed, install it.
If you know that you have gnuplot installed on your sysytem, try
$ cd threads-charts-XXX
$ gnuplot -persist Linux_i686_ono-sendai_gnuplot.gp
If you don't have such a *_gnuplot.gp file, the script make_output failed (if you also don't have a file named threads_test, the compilation failed).
When loading the CSV file, i don't get separated columns, all 5 results are in one field
Change the semicolons in the CSV file to colons.

